Trading180

ADVANCED TECHNICAL ANALYSIS
Introduction
The Forex markets have a tendency to behave in certain ways under certain conditions. This behaviour repeats itself, meaning that certain price patterns will occur time and again. Candlestick price patterns and Forex technical indicators attempt to recognise a reversal or continuation in price and give forex traders an edge by exploiting that knowledge.
Below are some of the more well-known candlestick price patterns and forex technical trading indicators.
Candlestick Price Patterns
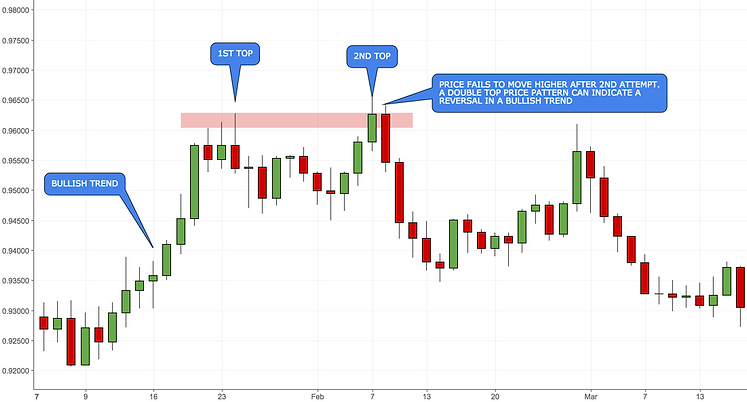
Double tops and bottoms
Double tops or double bottoms can form after a sustained trend, signalling to traders that the trend may be about to reverse. These patterns are created when a price movement nudges support or resistance levels twice and fails to break through them. This behaviour is often a signal of an intermediate or long-term trend reversal.

Triple tops and bottoms
Like the double top and bottom candlestick pattern formation, the triple top and bottom candlestick patterns are considered to be a possible reversal in price after a bullish or bearish trend. Many traders consider the market trying to drop below a support level three times (triple bottom) or rise above a resistance level three times (triple top) before giving up, a strong sign of a reversal in price.


Head and shoulders
This is another trend reversal pattern that’s popular with traders. The first image demonstrates the head and shoulders candlestick pattern signal a likely downward move after the market has been in a bullish trend.
-
Sellers come in at the highs of the left ‘shoulder’
-
These sellers force prices back to the support level of the base ‘neckline’
-
Buyers soon return to the market and push through to the new highs of the ‘head’
-
However, the sellers turn these new highs back again, testing the support once more
-
Buyers re-enter but with less strength, this time, and they fail to take out the previous high of the ‘head’
-
The buyers give up and the market tests the support yet again, eventually breaking through it

The below image demonstrates an 'inverse' head and shoulders candlestick pattern signal a likely upwards move after the market has been in a bearish trend.

Fibonacci Retracement Tool
Fibonacci was an Italian mathematician born circa 1170, who introduced the golden ratio to European mathematics.
He also came up with a sequence in which each number, plus the previous number, equals the next number. Thusly, the Fibonacci sequence: 1,1,2,3,5,8,13,21 and on it goes forever. His work is interesting for many reasons.
It has interesting applications in algebra and geometry as well as describing natural phenomena, such as plants flowering and the way leaves grow on trees.
Market traders noticed they could apply Fibonacci’s work for their own purposes. Trends, they found, would often conform to certain Fibonacci ratios.
Fibonacci Ratios
From the Fibonacci Sequence comes a series of ratios, and it is these ratios that are of special significance to traders.
The most important Fibonacci ratio is 61.8% - it is sometimes referred to as the "golden ratio" or "golden mean".
The Golden Ratio is arrived at by dividing any number in the sequence by the number that immediately follows it. No matter which number you choose, the answer will always be very close to the mean average of 0.618, or 61.8%. For example:
8 divided by 13 = 0.615 = 61.5%
13 divided by 21 = 0.619 = 61.9%
21 divided by 34 = 0.617 = 61.7%
The other two Fibonacci Ratios that forex traders use are 38.2% and 23.6%. The 38.2% ratio is derived by dividing any number in the sequence by the number found two places to the right. For example:
8 divided by 21 = 0.380 = 38.0%
144 divided by 377 = 0.381 = 38.1%
6765 divided by 17,716 = 0.381 = 38.1%
23.6% ratio consists of any number in the sequence divided by the number that is three places to the right:
5 divided by 21 = 0.238 = 23.8%
34 divided by 144 = 0.236 = 23.6%
6765 divided by 28,667 = 0.235 = 23.5%
Fibonacci Retracements
Retracement refers to the tendency for a currency pair to "correct" after a particularly large move in a currency pair. Fibonacci Retracements are considered a predictive technical indicator as they attempt to identify a future exchange rate.
The first way traders use Fibonacci levels is to help time entries when buying or selling. Buyers will look for a retracement to a Fibonacci level in an uptrend:


Moving Average
Moving averages take a fixed set of data and give you an average price. At its root, a moving average is simply the last X period’s price divided by the number of periods. This gives us the ‘average’ price over the last x periods. And this will be expressed on the chart, much like price itself.
For example, a 5-period moving average will calculate the price of the last 5 candlesticks and divide that number by 5 to give the average price reflected as a moving average indicator on a price chart.
If the period average is moving higher and price is above the moving average, traders will take this as a bullish trend signal. If the period average is moving lower and price is below the moving average, traders are likely to interpret the market to be in a bearish trend. Moving averages are simple to use and can be effective in recognizing trending or ranging market environments so that traders can be better positioned for the next move. The popular moving average periods used by forex traders are the 10, 20, 50, 100 and 200.
Often traders will use more than one moving average because two moving averages can be treated as a trend trigger.


Often, traders will use more than one moving average because two moving averages can be treated as a trend trigger.

MACD
The moving average convergence divergence (MACD) is a Forex indicator designed to gauge momentum. As well as identifying a trend, it also attempts to measure the strength of the trend.
The indicator plots two lines on the price chart.
The MACD line is typically calculated by subtracting the 26-period Exponential Moving Average from the 12-period EMA (an exponential moving average or EMA is one where more weight is given to the latest data). A 9-day EMA called the "signal" (or "trigger") line is plotted on top of the MACD to show buy/sell opportunities. The MACD-Histogram represents the difference between MACD and its 9-day EMA, the signal line.
When the MACD line crosses below the signal line, it is a sell signal.
When it crosses above the signal line, it is a buy signal.

Bollinger Bands
The purpose of Bollinger Bands is to provide a relative definition of high and low. By definition, prices are high at the upper band and low at the lower band.
A Bollinger band is a volatility channel invented by financial analyst John Bollinger more than 30 years ago.
The Bollinger band uses two parameters:
-
the number of days for the moving average
-
the number of standard deviations that you want the band placed away from the moving average.
The most common values are 2 or 2.5 standard deviations. In statistics, the standard deviation is a measure of how spread apart the values of a data set are. In finance, standard deviation acts as a way of gauging volatility.
A Bollinger band will adjust to market volatility. It widens as volatility increases and narrows as volatility decreases. A trend-following system using Bollinger bands might use two standard deviations and a 20-period moving average.
The use of Bollinger Bands varies widely among traders. Some traders buy when price touches the lower Bollinger Band or sell when price touches the upper Bollinger Band...

Other traders buy when price breaks above the upper Bollinger Band or sell when price falls below the lower Bollinger Band.

Relative Strength Index
The relative strength index (RSI) was developed by J. Welles Wilder and is a technical indicator intended to chart the current and historical strength or weakness of the forex market based on the closing prices of a recent trading period. The RSI provides signals that tell traders to buy when the currency is oversold and to sell when it is overbought.
The RSI is most typically used on a 14-period time frame, measured on a scale from 0 to 100, with high (overbought) and low (oversold) levels marked at 70 and 30. More extreme high and low levels for example 80 and 20, or 90 and 10, occur less frequently but indicate stronger overbought and oversold signals.
Traders assume that an oversold signal on a currency pair is an indication that the falling market trend is likely to reverse (a bullish signal) and is treated as a buying opportunity. Likewise, an overbought signal is used as an indication that a rising market trend is likely to reverse and is treated as a sell opportunity.

Trading Confluence
Trading confluence means that a Forex trader is analysing whether various tools and instruments confirm support and resistance at a similar or same spot on the chart.
For instance, if a resistance level, a 61.8% Fibonacci retracement ratio, and triple top candlestick formation all align themselves at one spot on the chart, then this is called trading confluence. There is a combination of elements joining together at one point on the chart.
When various technical indicators and candlestick price patterns are confirming a spot on the chart to be of importance, then the likelihood of price reacting to this level increases. In general, price moves from one level of support to the next level of resistance, and it is the trader’s judgment to analyse which levels are worth trading. By having layers of confluence at one spot, the trader improves their ability to understand which levels are critical and worth trading.
